


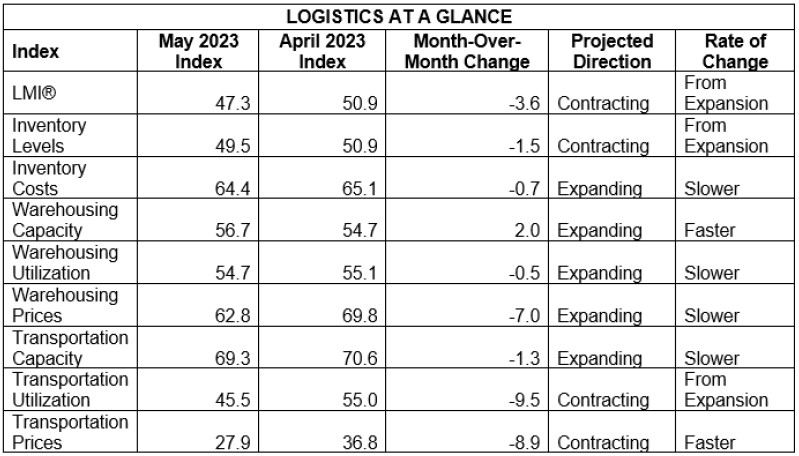
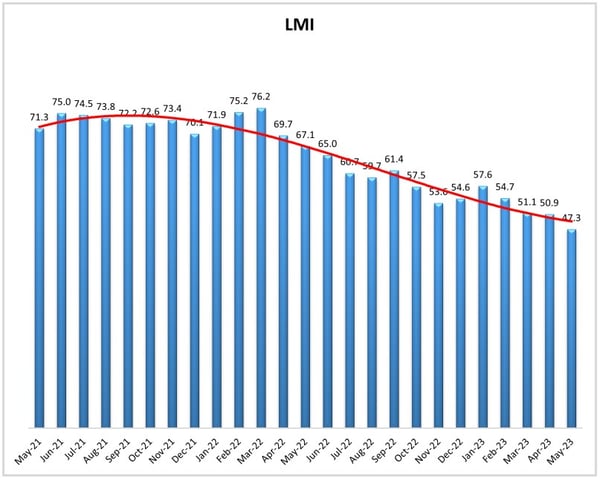
The Logistics Managers' Index (LMI) has fallen below 50, indicating contraction, for the first time in its more than six-year history. The May index fell 3.6 points from April's previous all-time low, to a mark of 47.3. The culprit is a soft freight market that's getting softer according to the LMI. Transportation Utilization - after a solid gain in April - dropped 9.5 to 45.5 and into contraction territory as well.
Transportation Prices - which also jumped the month prior - fell 8.9 to the lowest index figure (and the metric's all-time low) of 27.9. LMI authors say the combination of these two measures indicate shippers are using less available space, and because of the widely available capacity, prices are following suit.
Other metrics are failing to save the overall index this time as well, as all but one of the LMI's eight underlying indices fell month-to-month. Inventory Levels joins the aforementioned transportation metrics in contraction territory - it for the first time since February 2020 after a drop to 49.5. Even the still-growing Warehousing Prices index dropped seven points to 62.8, its lowest figure since June 2020, with LMI authors anticipating further declines as long-term contracts end in the coming months.
Looking forward, survey respondents echo last month's attitudes with an outlook that's grown increasingly pessimistic for the next 12 months, with further declines in the index predicted among key indicators. LMI authors say interest rates continue to factor in the freight market outlook. Beyond that, they offer a sort of chicken and egg argument, that decreased logistics costs have contributed to decreased inflation. That, in turn, could lead interest rates to level off, which would help a freight recovery. Authors say though, it appears the market will have to hit a bottom before the bounce-back, but it's unclear how much lower things can go before that bottom occurs.
By the Numbers
See the summary of the May 2023 Logistics Managers' Index, by the numbers:

About the Logistics Managers' Index (LMI)
Researchers at Arizona State University, Colorado State University, Rochester Institute of Technology, Rutgers University, and the University of Nevada, Reno - in conjunction with the Council of Supply Chain Management Professionals (CSCMP) - issue the report. The LMI score is a combination of eight unique components that make up the logistics industry, including: inventory levels and costs, warehousing capacity, utilization, and prices, and transportation capacity, utilization, and prices. The LMI is calculated using a diffusion index, in which any reading above 50.0 indicates that logistics is expanding; a reading below 50.0 is indicative of a shrinking logistics industry. The latest results of the LMI summarize the responses of supply chain professionals collected in May 2023.
Need assistance with your shipping operations? Request a quote with us, and we'll get back to you to discuss your unique needs. Go to our Freight Guides to learn more about everything freight and logistics. Additionally, visit our blog for information and updates on the freight industry. Or start with these links below:
- Domestic Freight Services: Intermodal, Truckload, LTL
- Outsourced Managed Transportation Service Solutions