


 Logistics professionals are constantly optimizing the cost, capacity and service equation for their company to drive a competitive advantage.
With a company’s logistics and supply chain touching every functional area within a company the list of KPI’s (key performance indicators) can be extensive, although today’s transportation management software systems simplify the mechanics reporting.
We’ve compiled the following list of measurements that we find many companies using to evaluate the efficiency and effectiveness of their supply chain.
Many of the measurables are self explanatory, while others have some room for interpretation. On the open interpretation KPI’s you’ll find additional details to clear up any confusion on why they are important.
The key understanding for all the KPI’s is to track the trends over time for improvement and to benchmark them against market data where possible.
As to the external benchmarking see far too often where shippers compare their numbers against themselves, which for some line items is appropriate but not when it comes to the cost KPI’s. The internal benchmarking leads to logistics companies or consulting groups coming into the shipper and telling them they can beat their straight current rates by 8% to 12% before even employing the latest TMS technologies.
Of course, trend analysis does nothing without doing anything on the KPI’s that are not meeting the established goals, so a critical process in managing the business on the KPI’s requires actions that are to be taken to improve the problem areas.
Best Logistics and Supply Chain KPI & Metrics Categories
Freight Cost
Freight Characteristics
Claims
Customer Experience & Satisfaction
Vendor Compliance
Carbon Footprint
Carrier Compliance
With the categories outlined, let’s dive into the details.
Freight Cost
Freight cost is often the largest P&L item for a company, which puts cost at the top of the list for many although we’d like to change the thinking of the logistics group being a cost center versus it being a competitive advantage.
Financial measurements include:
-
Freight Cost per Unit or Pound
-
Outbound Freight Cost, as a Percent to Sales
-
Inbound Freight Cost, as a Percent to Purchases
-
Total Freight Costs, as a Percent to Sales
-
Breakdown of Linehaul, Fuel Surcharge & Accessorial Freight Costs
- It’s important to know the full breakdown in the expense for the following reasons:
- Accessorial costs will tell companies where their operational performance is hurting their overall freight costs and slowing down shipment deliveries to the customers.
- Addressing accessorial charges is a quick win for cost and performance.
- Detention charges draw the attention of the underlying situation of dock congestion operational performance issues.
- Not every company has the same baseline fuel surcharge, so here is another quick win that can be had by drawing up your own fuel schedule and requiring your freight providers to use your freight schedule.
- As a side pick-up, some logistics companies are known to not have a fuel schedule and push the envelope up when they feel they can.
- By breaking the line haul and fuel apart it is easier to understand what is driving the price and measure performance, particularly in rapidly changing diesel fuel price markets.
-
 Retail Chargebacks
 - Quite often these charges are hidden within purchasing and accounting records, but can be six figure numbers, which can be easily corrected.
- Chargebacks are either happening because of poor freight provider performance or poor internal options. Either way, they can be fixed and be a tremendous windfall.
-
Benchmark Freight Cost Against Market Rates
- By far this is the biggest win for any company, but one the vast majority of companies do not make as part of their monthly freight and logistics performance review because they are not aware of how easy it can be done without incurring major expense.
- The long and short of this is you don’t have to go to the largest 3pl’s to get this data or go to a consulting firm to get this data. With a few clicks of a button, your company can tie into various freight consortiums that have billions of dollars of spend on millions of transactions that allow any company to benchmark their data. For more on the topic, we recommend reading Freight Costs: An Insider’s Look on Freight Pricing Buyers Should Know.
-
Billing Accuracy Percentage
- If a carrier cannot bill properly, then it is hard to imagine their overall performance is to par.
Freight Characteristics
Freight Transits into Key Markets
-
% of Freight Spend in Each Freight Mode
- The reason for this measurement is to see if there are modal conversion opportunities that will save your company money.
-
% of Freight Cost by Zone
- If our company is a parcel shipper, then this is really for you. Both transit and cost can be improved if you change your distribution point or open up additional distribution points.
-
% of Freight Cost by Mile
-
% of Freight Run on Contracts vs Spot
- Another name for this measurement is percent compliance to the freight routing guide. The point here is a company’s best rates will be had via their negotiated contracts, not the volatile spot market.
- Keeping your company out of the freight spot market will keep your company’s freight cost within budget, with great delivery performance.
-
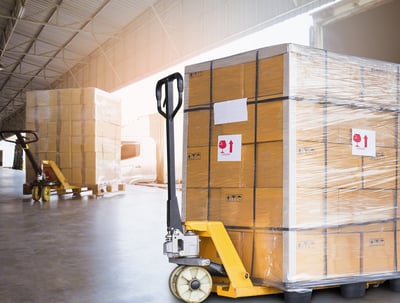
% of Trailer Utilized
- A motor carrier can haul 80,000 over-the-road, inclusive of the tractor weight. If your company has an opportunity to load more onto the trailer, then your cost per pound will go down and every “X” trailer will essentially be moving for free.
Claims
-
% Claims Cost per Total Freight Cost
- Claims can either be a result of a poor performing carrier or an internal issue with the shipping dock. We explore both symptoms in How-To Eliminate LTL Damage and OS&D Claims.
 Carbon Footprint
As the concept and desire of sustainable supply chains grow, so too is the importance of measuring it for a company’s shareholders.
There a few ways to go about measuring your company’s carbon footprint through major TMS systems, but for those companies that do not have a transportation management system to help them we suggest the following:
- Total miles and % of miles moved via a SmartWay Certified Carrier.
- Total miles and % of miles under intermodal and truckload, which as the percentage of intermodal increases so does the improvement in a shipper’s carbon footprint.
The above are rough estimations of measuring direction of improvement, while a top tier TMS will measure the total miles of the above, plus look at miles saved through consolidation and other modal conversions.
 Vendor Compliance
An increasing number of companies are issuing inbound routing guides to their vendors which outline their packaging, labeling, pallet configuration, etc of the product companies send into their supply chains to increase their efficiency of receiving and moving the product through their operations.
As part of this, the vendor compliance often includes how vendors are to route the freight into the shipper’s facility.
Whether compliance is associated with operational or freight efficiencies they both impact performance and cost, so measuring a vendor's adherence to your routing guide is important.
Customer Experience & Satisfaction
Many customer experience and satisfaction measurements are done by surveys like SurveyMonkey or other means. While the surveys have great intentions, they can be biased toward disgruntled customers versus happy customers. The reason for this is the customer often looks at it like they would which is no news is good news, while the disgruntled customers take it as an opportunity to unload their complaints.
If you are not onboard with the thought the surveys tend to be a bit biased toward the negative versus the positive, think of how often your DC gets a call for short-ships versus over-ships. The term over-ships does not even sound right because those calls never come, although there is an equal chance for a short-ship versus an over-ship.
 Stepping away from the soap box, the below is a few measurements to institute that take the subjective nature of a standard survey.
-
% Filled of Orders, Lines and Units
- This measurement should be done nightly after the DC shuts down to see the effectiveness of getting 100% on all three measurements for each and every customer served. The assumption is that if the customer fulfillment center fills 100% of their customer orders at all levels the customer will be satisfied with the service.
- The assumption of this measurement is a bit of a stretch if the next two measurements are not satisfied properly, which is why they are important in measuring also.
-
In Stock Backorders
- If the customer fulfillment center has in-stock backorders, it means they are not fulfilling 100% of what they have on their floor for the customer on a given day.
- This measurement should also be done on a daily basis to ensure there are eyes on this DC measurement because of its importance to meet retail turns and shelf space requirements to remain in the store planogram.
-
Order Fulfillment Turn Times
- In days past, mail orders were viewed as being well served when the customer received their shipment in 6 to 8 weeks. This is no longer the case in the fast paced ecommerce fulfillment when orders in by 6:00 PM are to be out the same day making this being the benchmark to measure your order fulfillment team’s performance.
Pick-Up & Delivery Performance
Both measurements are critical for a company’s customer base and its own operation.
Just-in-time manufacturing industries, such as automotive, make this critical to the operations because the lack of product will shut the assembly lines down and cause the automaker to send its employees home with pay, yet no production.
Similar effects occur with customers and create a ripple effect in the entire delivery timeline.
 Partner Carrier Compliance
Last but not least on our list of key measurements in a logistics and supply chain is the performance of the carriers compliance to key data required by companies to stay on top of their actions and communications required to orchestrate their business efficiently and accurately.
- Timely entry of status messages into the TMS
- Accuracy of information into TMS
Low scores on either drive too many calls, questions, distrust and otherwise, so it’s best to fix quickly or find another provider that you can count on to have the shipment and information required to succeed.
Conclusion of Logistics and Supply Chain KPI’s
In today’s complex supply chains, information and measurables to take the pulse of the performance is critical. We realize not all companies are the same and put importance on different aspects of their business.
Our hope is we met the goal of giving a broad brushed review of critical measurements that can serve as the base for your company to expand upon as more is learned through the key performance indicators discussed in this article.
 Additional Resources on Managed TMS Service Solutions:
- The Comprehensive Guide on Freight Management Services
- How Much Does Managed Transportation Cost? A Comprehensive Guide
- 2020 Best Managed Transportation Companies (And How to Choose)
- SmartWay Certification Explained
- Freight Costs: An Insider’s Look on Freight Pricing Buyers Should Know
- Best Transportation Management System (TMS) Software Packages
If you're ready to take the next step, at InTek Freight & Logistics, we can help. Just tell us what you need and we'll discuss how our expertise can help with the unique shipping challenges your business faces. Rather do a bit more research first? View our Freight Guides for comprehensive articles and eBooks on all things freight and logistics.