

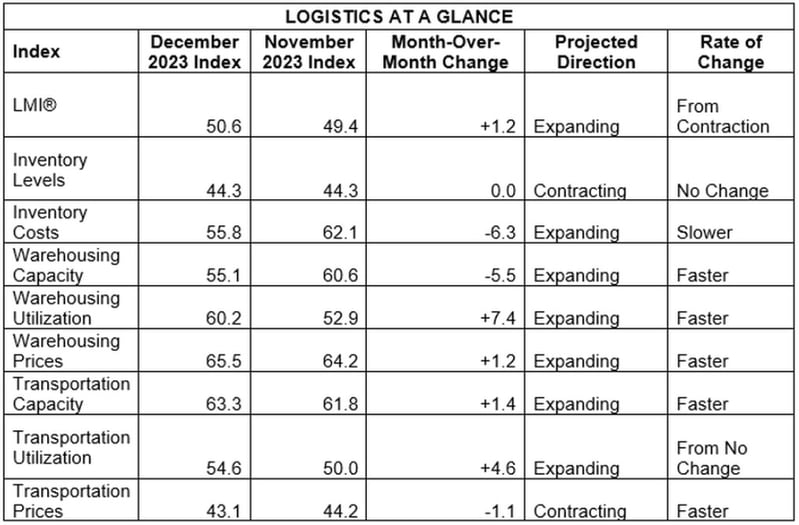
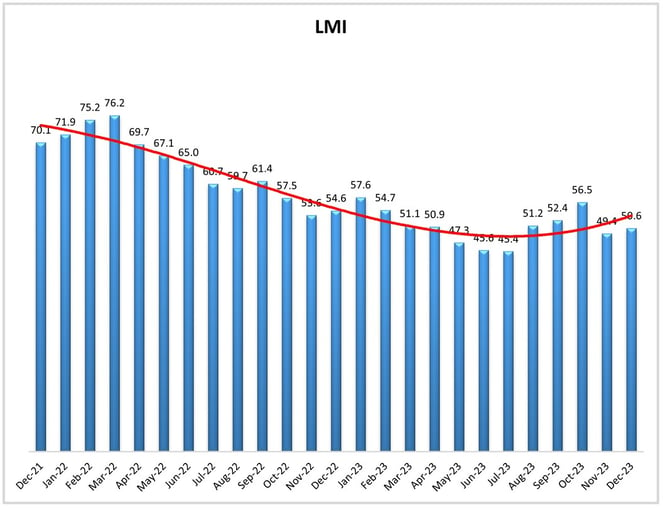
After falling into contraction in November, the December Logistics Managers' Index (LMI) ticked back up 1.2 points, moving it back into expansion at 50.6. The quick bounce back keeps the LMI on a positive track as 2023 ends, with readings above 50 three out of the last four months.
So why did the index rebound again after a dip in November? LMI authors point to warehousing activity, as Warehousing Capacity dropped 5.5 to 55.1, Warehousing Prices rose 1.2 to 65.5, and Warehousing Utilization moved the most, up 7.4 to 60.2. Inventory Levels were unchanged month to month, at 44.3, while Inventory Costs - a metric that's never been in contraction in LMI history - were down 6.3 to 55.8 (the lowest level ever for the index).
Why the drop in Inventory Costs? An increased emphasis on just-in-time inventory strategies, something that bears watching as a nearshoring push continues. In that vein, analysts are expecting things to get even busier between Mexico and the U.S. in 2024 - and intermodal strategies are expected to be a big part of it.
LMI authors remind that December figures across the board are closely tied to the holiday shopping season, which was a strong one - particularly with online shopping which showed growth of 6.3%. The increased consumer spending is at least partially tied to a continued easing of inflation, which is now approaching a Federal Reserve target that stock market experts expect will lead to a decline in interest rates this year.
With all that being said, the news for the transportation-related metrics is less positive in December. While Transportation Utilization rose 4.6 to 54.6 (more firmly into expansion), Transportation Capacity also increased 1.4 to 63.3. That capacity increase almost directly ties into the Transportation Prices metric, which saw a drop of 1.1 to 43.1, remaining deep in contraction. LMI authors say, though, that prices are partially down due to gas prices, which are well below the average of the past two years.
Asked to predict the future of the LMI, survey respondents were even more optimistic in December for where it would stand in 12 months, projecting an LMI at 59.9 (up 2.5). Such a reading would be near the LMI's all-time average of 62.5 and, authors say, would represent a healthy rate of expansion.
By the Numbers
See the summary of the December 2023 Logistics Managers' Index, by the numbers:
View Logistics Managers' Index - Dec. 23
About the Logistics Managers' Index (LMI)
Researchers at Arizona State University, Colorado State University, Rochester Institute of Technology, Rutgers University, and the University of Nevada, Reno - in conjunction with the Council of Supply Chain Management Professionals (CSCMP) - issue the report. The LMI score is a combination of eight unique components that make up the logistics industry, including: inventory levels and costs, warehousing capacity, utilization, and prices, and transportation capacity, utilization, and prices. The LMI is calculated using a diffusion index, in which any reading above 50.0 indicates that logistics is expanding; a reading below 50.0 is indicative of a shrinking logistics industry. The latest results of the LMI summarize the responses of supply chain professionals collected in December 2023.
Need assistance with your shipping operations? Request a quote with us, and we'll get back to you to discuss your unique needs. Go to our Freight Guides to learn more about everything freight and logistics. Additionally, visit our blog for information and updates on the freight industry. Or start with these links below:
- Domestic Freight Services: Intermodal, Truckload, LTL
- Outsourced Managed Transportation Service Solutions